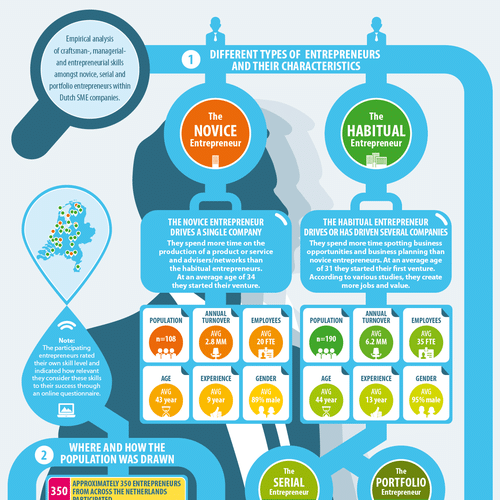
In today’s fast-paced, information-driven world, visual content plays a pivotal role in making complex data and research more accessible and engaging. Research infographics, in particular, have emerged as a key tool for simplifying complicated datasets, concepts, and trends, offering a clear, visually appealing way to present findings. These infographics combine elements like graphs, charts, icons, and text to convey complex ideas succinctly and effectively, and they are widely used in academic, business, and marketing settings.
DoNotEdit, a service best known for its AI detection capabilities, also provides artwork services specifically designed for creating research infographics. These services are aimed at helping researchers, educators, businesses, and marketers craft high-quality, custom visuals that effectively present data and research findings. Unlike typical graphic design services, DoNotEdit’s focus goes beyond aesthetics; it aims to help users produce infographics that are not only visually attractive but also effective in communicating complex information in a straightforward and engaging manner.
This introduction explores DoNotEdit’s artwork services for research infographics, discussing the importance of infographics in research communication, the unique features of DoNotEdit’s services, and the benefits they bring to a wide range of industries.
Why Infographics Are Essential in Research Communication
As the volume of data generated in research fields continues to grow, researchers are faced with the challenge of communicating complex information in a way that is both understandable and engaging. Raw data, when presented without context or explanation, can often overwhelm or confuse audiences. Research infographics provide an effective solution by transforming this data into visual elements that are easier to interpret and engage with.
Here are several reasons why infographics have become essential for research communication:
Simplifying Complex Data: Infographics are effective at distilling large, complex datasets into manageable visual elements like pie charts, line graphs, and infographics, making it easier for audiences to understand the main points quickly.
Capturing Attention: Visual content naturally draws more attention than dense text, making infographics an excellent tool for engaging the audience and ensuring the information is noticed.
Enhancing Retention: Studies show that people are more likely to remember visual information compared to text alone. Infographics help increase the likelihood that key findings and insights will be retained over time.
Improving Accessibility: Infographics make complex research findings more accessible, enabling a broader range of people—including those without deep subject-matter expertise—to understand the key points.
Whether it’s summarizing a research paper’s findings, illustrating trends, or showcasing relationships between variables, infographics have become a go-to method for presenting research in a digestible and engaging format. This is particularly true in fields such as academia, business, healthcare, and marketing, where clarity and precision are essential.
Overview of DoNotEdit’s Artwork Services for Research Infographics
DoNotEdit’s artwork services provide researchers, businesses, and marketers with custom-designed research infographics that effectively communicate data and findings. These services are designed to cater to various types of users, from academic researchers who need to present complex scientific data to businesses looking to create compelling visuals for reports or marketing materials.
Key Features of DoNotEdit’s Artwork Services
1. Tailored Designs for Specific Research Needs
One of the standout features of DoNotEdit’s artwork services is the ability to create customized infographics based on the client’s specific research or business goals. DoNotEdit understands that each project is unique, so they work closely with clients to ensure that the visual design is aligned with the key message they want to communicate. Whether the goal is to illustrate a comparison between datasets, showcase a timeline, or highlight key insights from research findings, DoNotEdit ensures that the final infographic clearly represents the intended data in an impactful way. This personalized approach ensures that the infographics are not only visually appealing but also optimized for the specific audience, whether they are academic peers, business stakeholders, or the general public.
2. Expertise in Data Visualization
Effective data visualization is at the heart of every great research infographic, and DoNotEdit excels in this area. Their team of experts uses advanced techniques to turn raw data into intuitive visual representations, ensuring that the key findings stand out. Whether it’s using pie charts to show proportions, line graphs to represent trends over time, or flowcharts to explain processes, DoNotEdit ensures that the data is accurately represented in a visually clear and appealing way. By utilizing a range of visualization techniques, DoNotEdit ensures that even the most complex datasets are presented in a way that is accessible to both experts and general audiences. This ensures that research is not only easier to understand but also more engaging.
3. Static and Interactive Infographics
DoNotEdit offers the flexibility to create both static and interactive infographics. Static infographics are ideal for printed materials or traditional presentations, such as research papers or conference posters. These infographics are designed to be easily printed or shared in digital formats like PDFs. Interactive infographics, on the other hand, are better suited for digital platforms where users can engage with the content. Interactive elements might include clickable charts, hover-over details, or zoom-in capabilities, allowing users to explore the data in more depth. This type of infographic is particularly effective for websites, online reports, and presentations. DoNotEdit’s ability to create both static and interactive designs ensures that clients can choose the most appropriate format for their specific use case.
4. Collaborative Process and Feedback
Creating high-quality research infographics is a collaborative effort, and DoNotEdit prioritizes communication throughout the design process. Clients can provide input, suggest revisions, and guide the direction of the design. The iterative process allows DoNotEdit to refine the visual elements until they align with the client’s vision, ensuring that the final product meets all of the client’s needs. This collaboration ensures that the client is fully satisfied with the outcome and that the infographic effectively communicates the key messages of the research.
5. Seamless Integration with Research Tools
DoNotEdit’s artwork services are designed to integrate smoothly with other tools used in research or business workflows. Whether clients are using citation management systems, data analysis software, or content management platforms, DoNotEdit ensures that the infographics can be easily incorporated into their larger research or presentation materials. This compatibility is especially valuable for researchers and businesses who need to ensure that their infographics work seamlessly within their existing processes. The platform also allows infographics to be easily shared across various platforms, including websites, social media, and email, ensuring a wider reach for research findings or business insights.
6. Consistency with Branding Guidelines
For businesses and organizations, maintaining brand consistency is key. DoNotEdit understands this and ensures that each infographic aligns with the client’s existing branding guidelines. From color schemes to typography and logo placement, every aspect of the infographic is tailored to fit the company’s visual identity. This helps businesses maintain a professional image and ensures that all communications, including research reports, adhere to brand standards.
Benefits of DoNotEdit’s Artwork Services
The artwork services provided by DoNotEdit offer numerous advantages for clients working on research projects across various industries. Here are the primary benefits:
1. Enhanced Communication and Clarity
By turning complex data into simple, visual formats, DoNotEdit helps researchers and businesses communicate their findings clearly and effectively. Infographics allow the audience to grasp the key points quickly, making the research or report easier to understand.
2. Increased Engagement and Reach
Infographics are highly shareable, making them more likely to be distributed across social media platforms and other digital channels. By creating visually appealing, informative infographics, DoNotEdit helps clients increase the reach and engagement of their research findings, reports, or marketing materials.
3. Time and Effort Savings
Creating high-quality infographics requires specialized skills in both design and data visualization. DoNotEdit’s professional design team handles the entire process, saving clients time and allowing them to focus on other aspects of their research or business tasks. The team ensures that the final product meets the highest standards of design and functionality.
4. Professional-Level Design
With DoNotEdit, clients gain access to experienced designers who specialize in creating effective research visuals. Whether the goal is to produce a detailed academic infographic or a simple business report visual, clients can expect professional-level design that adds credibility to their work.
5. Customization for Diverse Use Cases
DoNotEdit’s services are highly adaptable, ensuring that clients can create infographics that are tailored to their specific needs. Whether the project involves illustrating scientific findings, business performance, or marketing strategies, DoNotEdit provides customized designs that fit the context and audience perfectly.
DoNotEdit’s artwork services for research infographics offer a powerful solution for transforming complex data into clear, visually compelling visuals. With expertise in data visualization, custom design, and seamless integration with existing research tools, DoNotEdit helps clients effectively communicate their findings to a wide range of audiences. Whether for academic, business, or marketing purposes, DoNotEdit’s infographics provide a highly effective way to present research and insights in a format that is both informative and engaging. By leveraging DoNotEdit’s services, users can create infographics that not only enhance understanding but also increase engagement and shareability, maximizing the impact of their research and data.
